2.1 Showing a World Map
This tutorial will guide you in manipulating and visualizing GIS data in MicroCity.
Loading Data and Creating a Map
Download the countries.shp (ArcGIS shapefile) and the countries.dbf (dBase file) in a same folder. Open  MicroCity and load
  or drag the countries.shp into MicroCity and select Data Tab in Workspace panel. Double click Data->Shapes->Polygon->01. countries in Workspace panel.
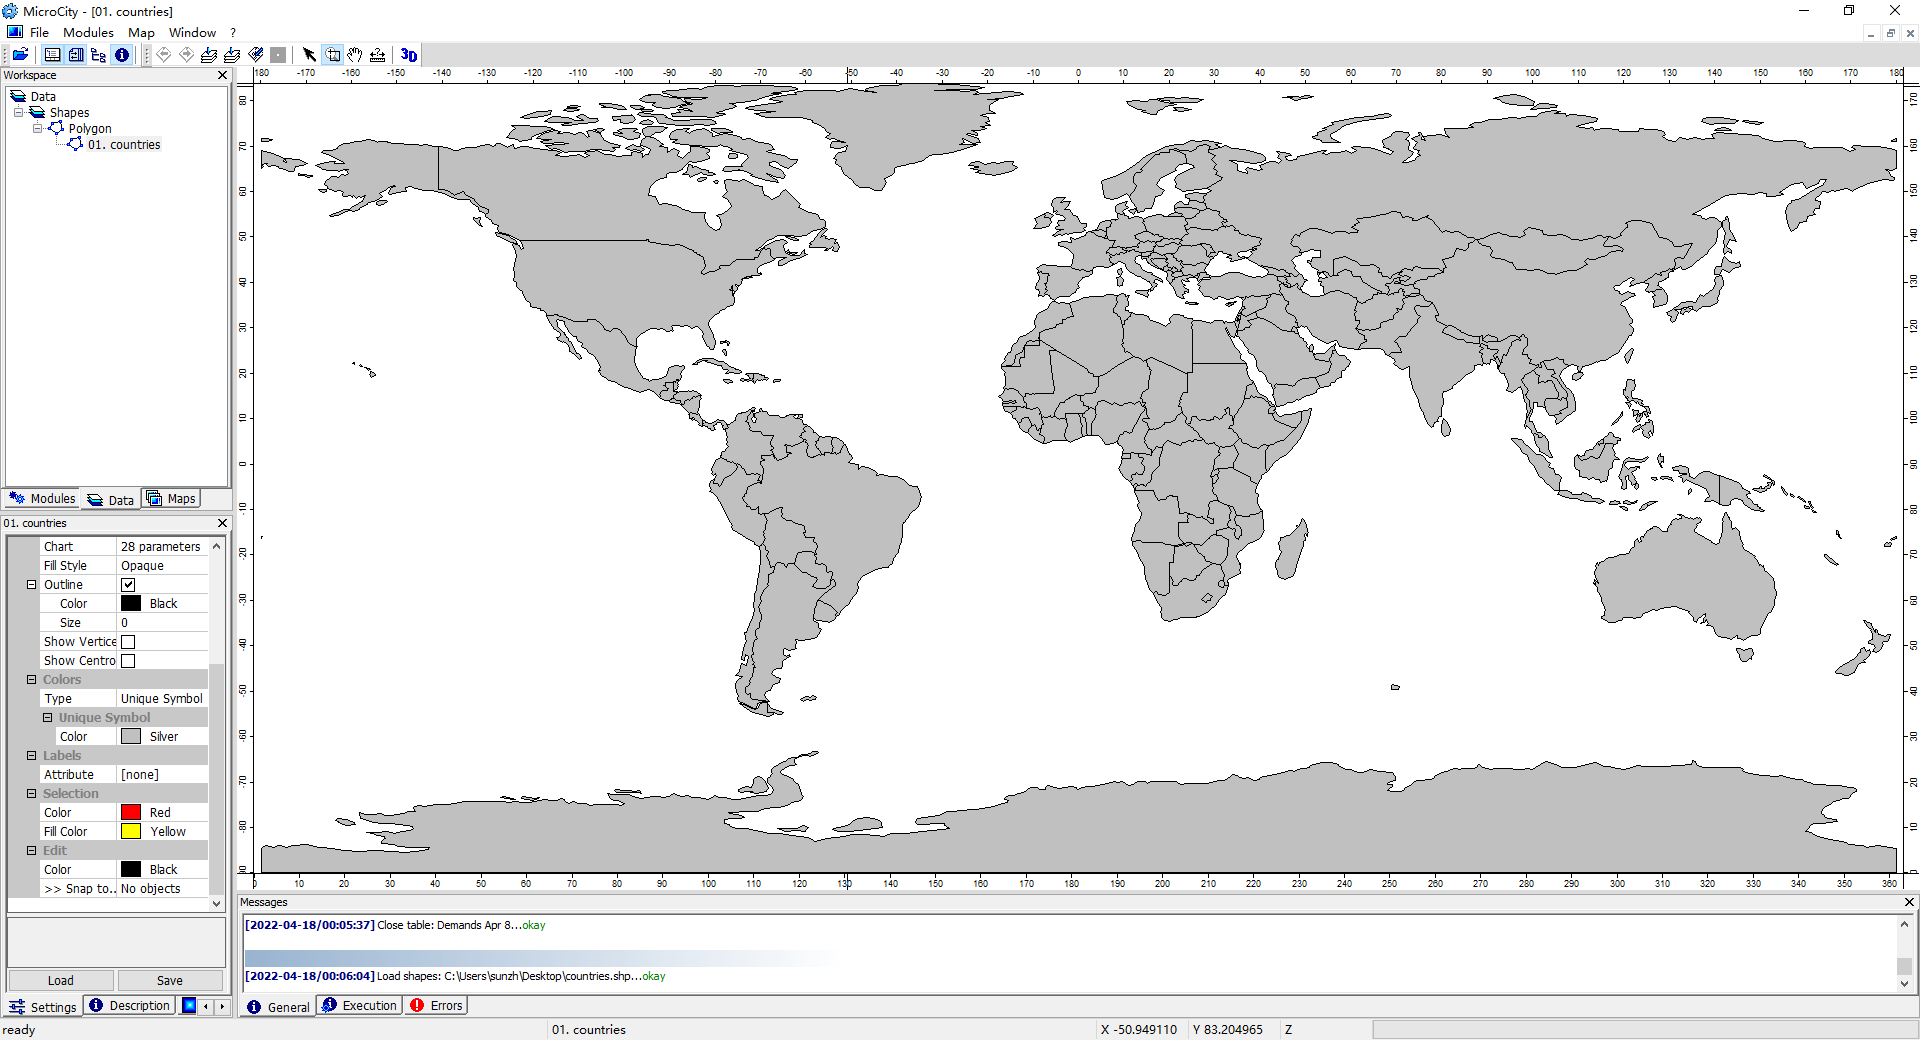
Visualizing Coutries' Properties
Right click  01. countries in the Workspace panel. Click Attributes->Table->Show in the popup menu. In the Settings Panel, find the Colors->Type option and select Graduated Color. In its sub-option Attribute, select POP_EST which is population property of countries. In the Setting Panel, find the Chart option and click the ... button. In the popup dialog, select pie in Chart Type option and select GDP_MD_EST in Attribute (Size) option and select EXPORT and IMPORT checkboxs in Fields option and click Okay button.
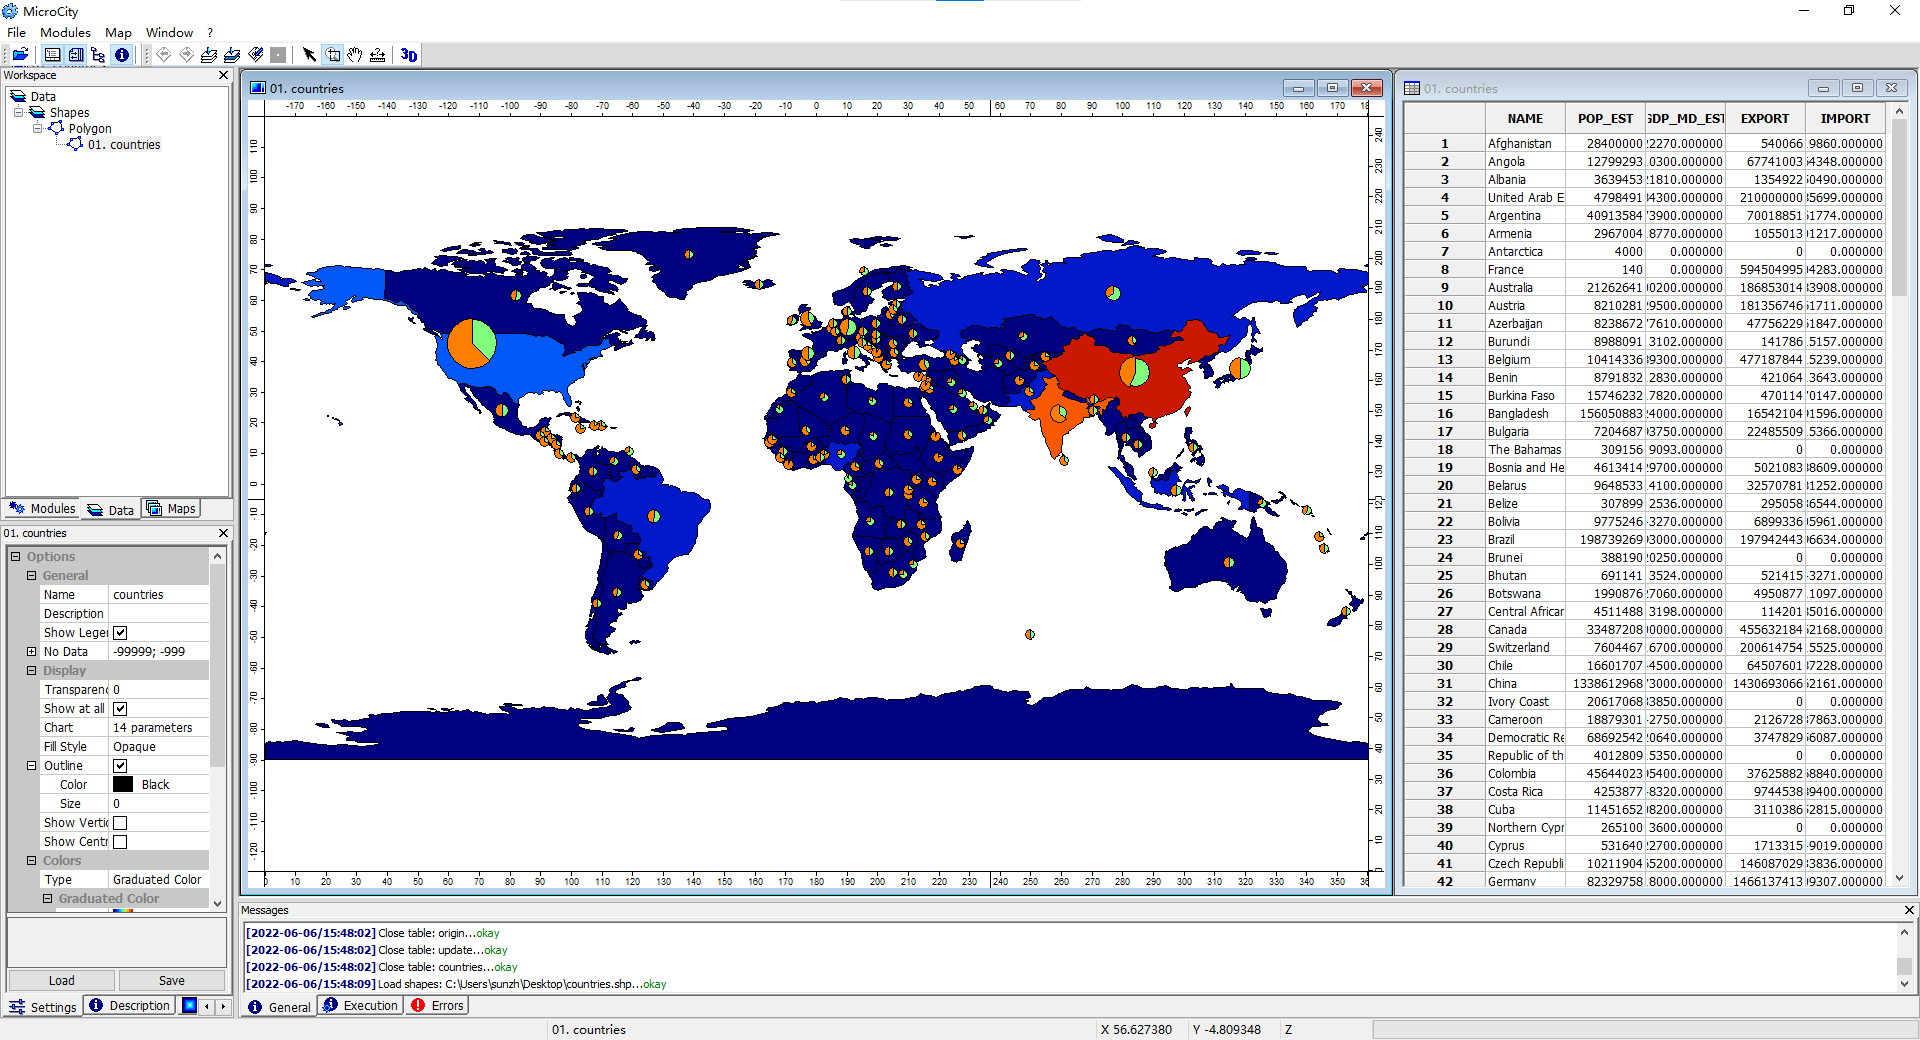
Editing Shapes
Select  Action button at toolbar. Left click some country and right click it and select Edit Selected Shape in the popup menu. Then the shape will be in editing mode. You can change its polygon points and finish your editing by right click and select Edit Selected Shape again.